Microarray analysis of embryogenesis time-course
To provide an independent measurement that will validate the results of each RNA insitu experiment we analyzed the relevant portion of Drosophila embryogenesis using Affymetrix Gene Chip technology. Gene Chips were chosen over spotted cDNA array because the probes that interrogate gene expression on Affymeytix arrays are designed computationally and have no physical link to the probes used to determine the insitu patterns.
Embryo collection and RNA isolation : Wild type CantonS flies were expanded to large quantities and the entire population was split into 12 population cages that were subsequently treated equally. For three consecutive days fresh apple juice plates were introduced to each cage in the morning to allow two hours clearing of the retained embryos. Subsequently females in each cage were allowed to lay eggs for one hour before all twelve plates were removed simultaneously and transferred to 25-degree incubator and aged for 30 minutes. From then on at the end of each hour for the next 12 hours embryos from one plate were washed of the plate dechorionated and frozen in liquid nitrogen. Overall three independent replicates of twelve one-hour embryogenesis windows were collected over the period of 3 days. Total RNA was isolated from all embryo samples using Ambion RNAwiz solution.
Small proportion of embryos from each sample was fixed, mounted on the slide. Using morphological landmarks we determined the proportion of embryos representing individual embryogenesis stages in each sample. This data were then used to approximately map the stages of embryogenesis onto the linear scale of collection time points.
Gene Chip measurement and data analysis: Labeled cRNA samples were prepared following standard Affymetrix protocol. 36 Drosophila GeneChips were hybridized and scanned with Affymetrix equipment. Scanned array images were analyzed using Affymetrix and dChip analysis software.
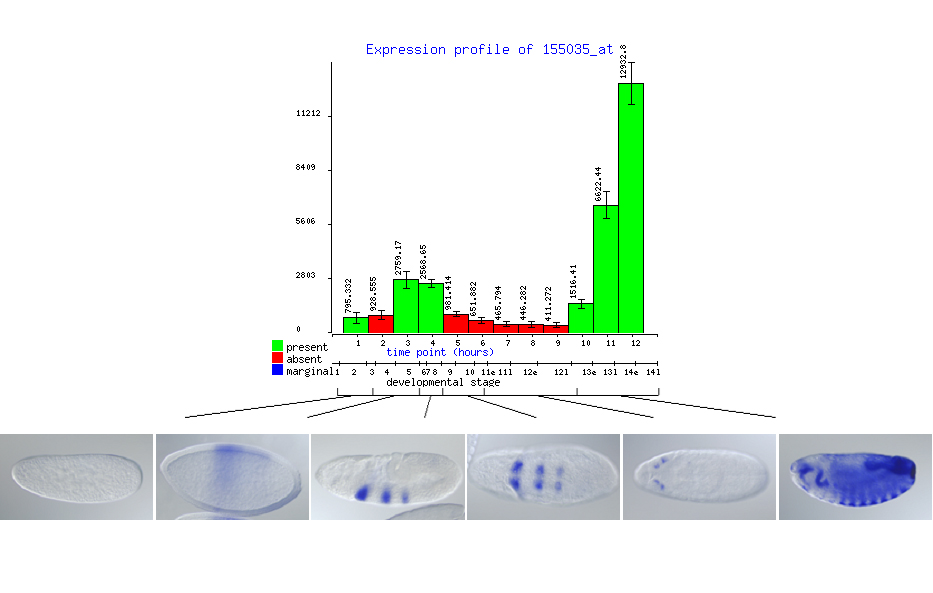
For the purpose of comparing image and microarray data and trying to establish correlation between them, we decided to represent each microarray profile in a form of bar graph showing the absolute expression measurements rather than log transformed centered values. Error bars represent the standard error of the three replicate measurements. The color of the bar indicates the result of Affymetrix absent/present call that attempts to estimate whether a given gene is or is not expressed in the interrogated sample. In case of whole animal microarray experiments the absent/present calls are only approximate since clearly in cases when a gene is expressed in only a small subset of embryonic cells the microarrays are not sensitive enough to detect the expression. The images representing gene expression patterns are grouped according to pre-defined stage-ranges. To correlate the microarray and the image data means to visually inspect the assembled images and try to match the fluctuations in staining intensity and distribution to the shape of the microarray profile. We observed that in most cases the intensity of the insitu staining and the microrray signal are generally comparable, meaning that weak staining is associated with low array values and heavy staining with very high array values. Fine comparison of the signal intensity from the two technologies is not possible due to variable strength of the insitu probes and differential hybridization properties of array oligonucleotides.